01Inside the app
SWIPE FOR MORE →
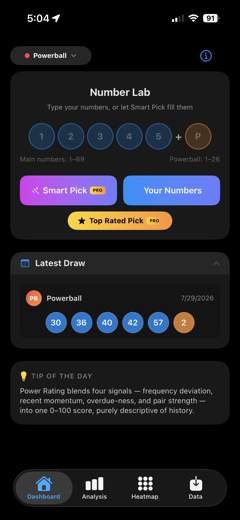
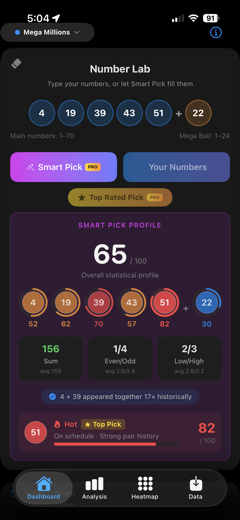
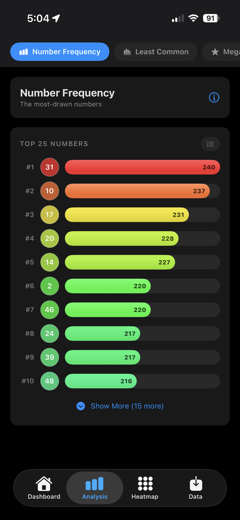
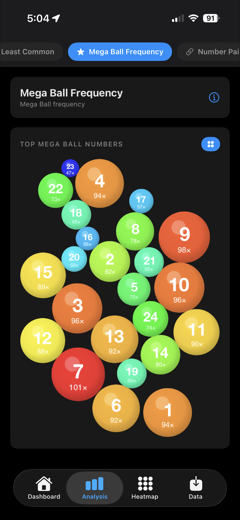
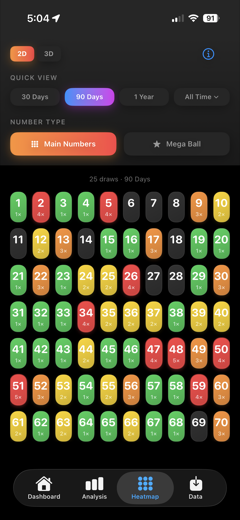
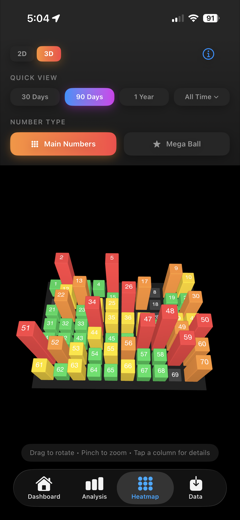
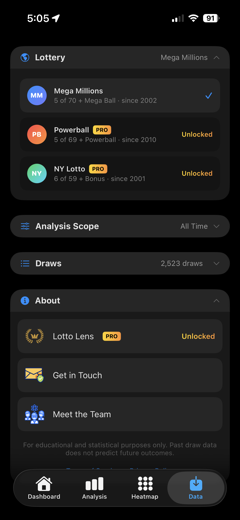
An educational statistics app for Mega Millions, Powerball and NY Lotto. Eleven analysis methods, a 2D and 3D interactive heatmap, and a number-profiling tool that scores any pick 0–100 — all computed on-device, fully offline, with zero tracking. It doesn't predict, guarantee, or improve odds; it shows you the real statistics behind the game.
Lotto Lens pulls draw history for Mega Millions, Powerball and NY Lotto from state open-data portals, stores it locally, and turns it into eleven analysis methods: frequency and least-common, bonus-ball frequency analyzed against its own pool, number pairs, hot streaks, even/odd and high/low distribution, number sums, gap/due analysis, a 0–100 Power Rating per number, and a chi-square fairness check that tests whether the selected draws are statistically consistent with a fair lottery.
The Analyze My Numbers tool scores each pick out of 100 — frequency rank worth 40 points, due ratio 30, pair strength 20, and even/odd plus high/low balance 10 — and tags it with what drove the score. The heatmap covers every number in the selected pool across five time ranges, in a colour grid or a rotatable 3D frequency terrain.
Built in Swift 5.9 / SwiftUI with MVVM and async/await, for iOS 17+. Everything runs on-device; after the first fetch it works fully offline, and it collects nothing about you. Mega Millions is free; Powerball, NY Lotto and the Pro pick tools unlock with Lotto Lens Pro.
Lottery apps have an ethics problem. The maths is easy; the temptation is to let a user believe that "31 is overdue" means something about tomorrow's draw. It doesn't — every number has the same probability in every drawing, always, and past results carry no information about future ones.
So the design question running through the whole app was how to show genuinely interesting historical patterns without implying predictive power. That shaped concrete decisions: the notice appears up front rather than buried in settings; the gap analysis describes an absence relative to a number's own historical average and stops there; and the language throughout stays descriptive — what has happened, never what will.
The fairness check is where that position gets tested rather than asserted. It runs a chi-square test over the selected draws and reports whether the distribution is consistent with a fair lottery — which, on real data, it is. An app selling the idea of beatable patterns would never ship a feature whose honest answer is "the numbers are random."
Getting that right mattered more than any single statistic in the app, and it's the part I'd defend hardest in review.